
Introduction
With India’s 2019 General Elections around the corner, I thought it’d be a good idea to analyse the election manifestos of its 2 biggest political parties, BJP and Congress. Let’s use text mining to understand what each party promises and prioritizes.
In this part 4, I’ll explore the Anti-corruption and Good Governance discussions in both manifestos.
Analysis
Load libraries
rm(list = ls())
library(tidyverse)
library(pdftools)
library(tidylog)
library(hunspell)
library(tidytext)
library(ggplot2)
library(gridExtra)
library(scales)
library(reticulate)
library(widyr)
library(igraph)
library(ggraph)

theme_set(theme_light())
use_condaenv("stanford-nlp")
Read cleaned data
bjp_content <- read_csv("../data/indian_election_2019/bjp_manifesto_clean.csv")
congress_content <- read_csv("../data/indian_election_2019/congress_manifesto_clean.csv")
Anti-Corruption and Good Governance
This topic is covered congress’ manifesto from Pages 17 to 19 of the pdf and in that of bjp’s from pages 24 to 26.
bjp_content %>%
  filter(between(page, 24, 26)) -> bjp_content

congress_content %>%
  filter(between(page, 17, 19)) -> congress_content
Most Popular Words
plot_most_popular_words <- function(df,
                                    min_count = 15,
                                    stop_words_list = stop_words) {
  df %>%
    unnest_tokens(word, text) %>%
    anti_join(stop_words_list) %>%
    mutate(word = str_extract(word, "[a-z']+")) %>%
    filter(!is.na(word)) %>%
    count(word, sort = TRUE) %>%
    filter(str_length(word) > 1,
           n > min_count) %>%
    mutate(word = reorder(word, n)) %>%
    ggplot( aes(x=word, y=n)) +
    geom_segment( aes(x=word, xend=word, y=0, yend=n), color="skyblue", size=1) +
    geom_point( color="blue", size=4, alpha=0.6) +
    coord_flip() +
    theme(panel.grid.minor.y = element_blank(),
          panel.grid.major.y = element_blank(),
          legend.position="none") -> p

  return(p)
}
custom_stop_words <- bind_rows(tibble(word = c("india", "country", "bjp", "congress", "government"),
lexicon = rep("custom", 5)),
stop_words)bjp_content %>%
plot_most_popular_words(min_count = 6,
stop_words_list = custom_stop_words) +
labs(x = "",
y = "Number of Occurences",
title = "Most popular words related to Anti-Corrution and Good Governance in BJP's Manifesto",
subtitle = "Words occurring more than 6 times",
caption = "Based on election 2019 manifesto from bjp.org") -> p_bjp
congress_content %>%
plot_most_popular_words(min_count = 8,
stop_words_list = custom_stop_words) +
labs(x = "",
y = "Number of Occurences",
title = "Most popular words related to Anti-Corrution and Good Governance in Congress' Manifesto",
subtitle = "Words occurring more than 8 times",
caption = "Based on election 2019 manifesto from inc.in") -> p_congress
grid.arrange(p_bjp, p_congress, ncol = 2, widths = c(10,10))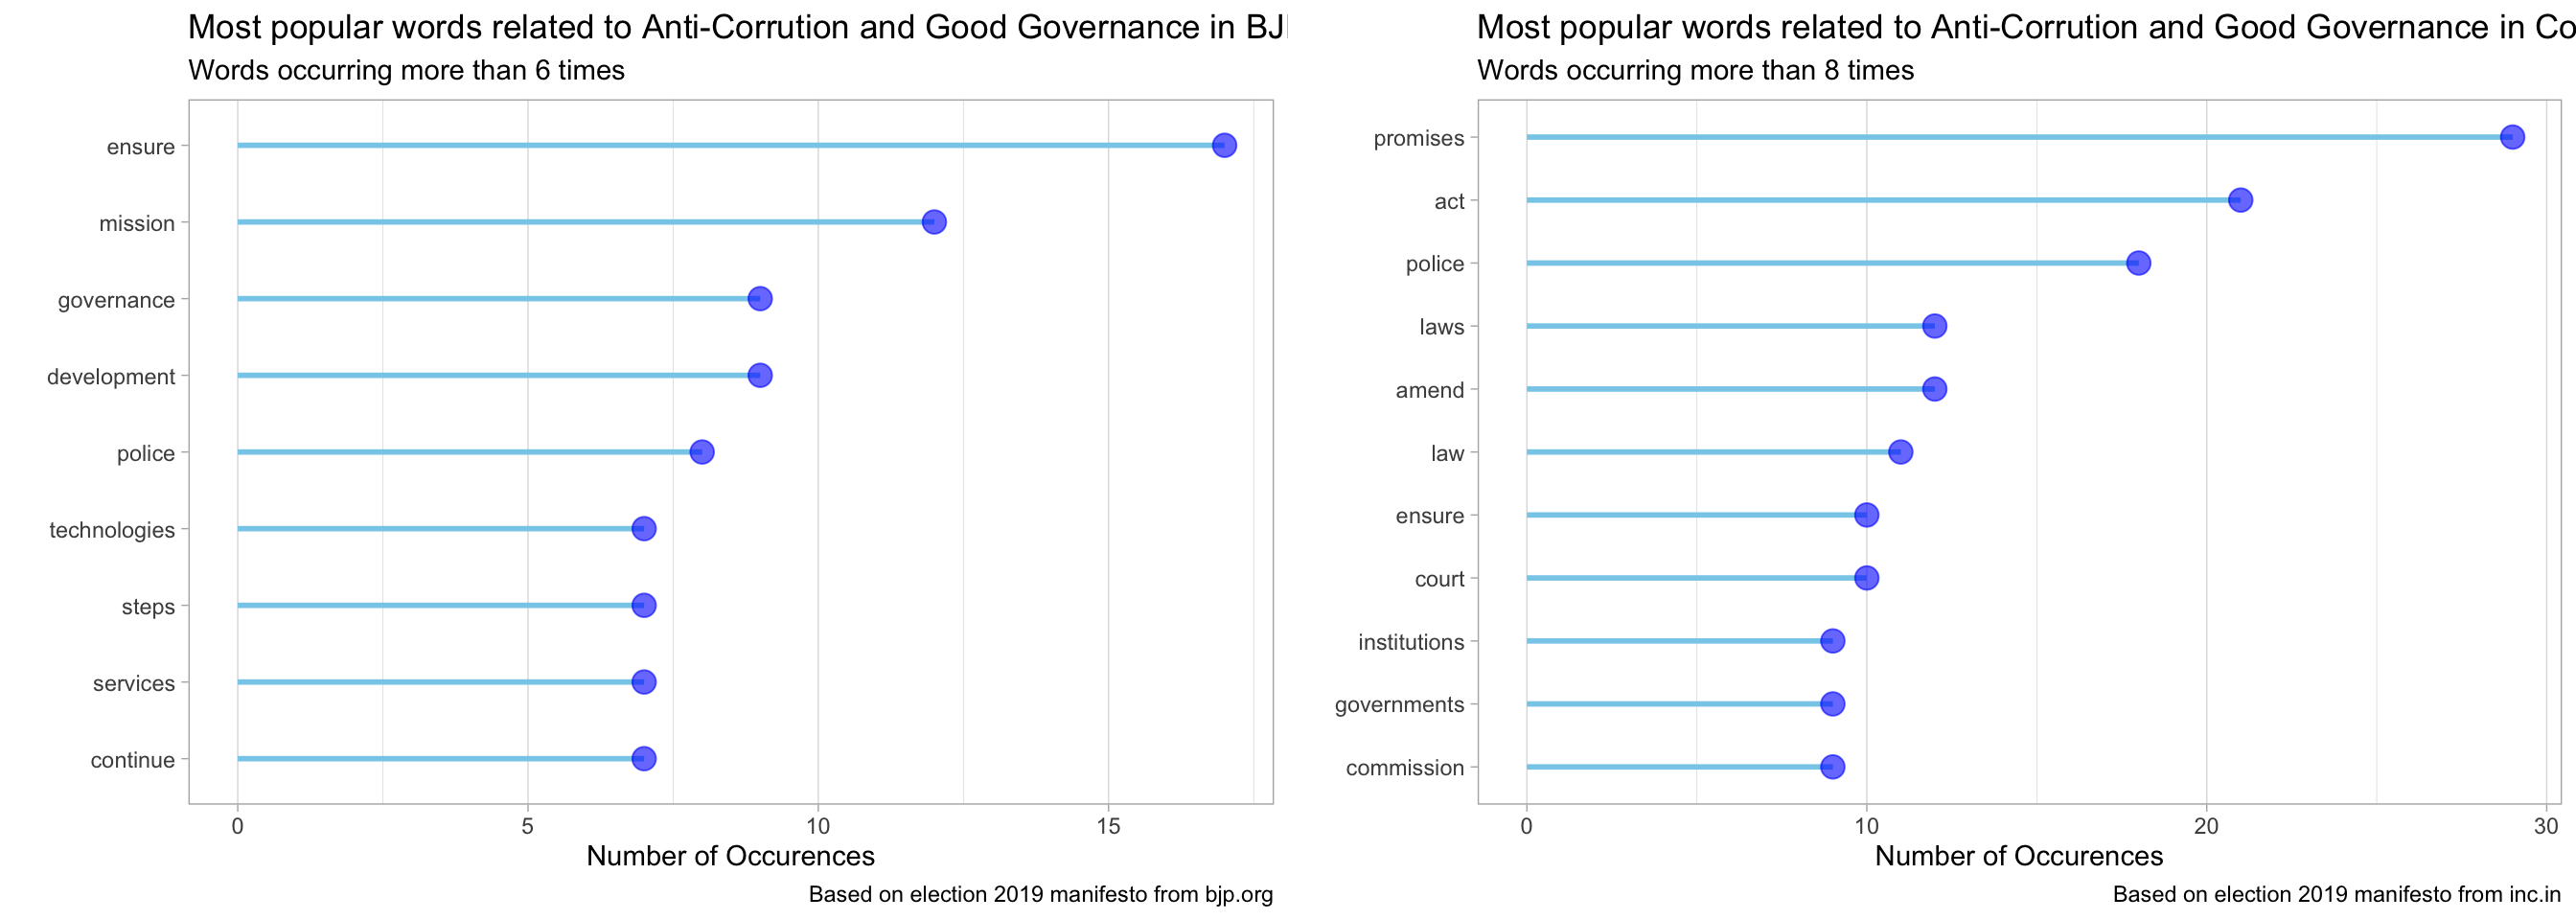
Common correlated words
plot_common_correlated_words <- function(df,
                                         counts_quantile = 0.7,
                                         correlation_threshold = 0.25,
                                         stop_words_list = stop_words) {
  set.seed(123)
  df %>%
    unnest_tokens(word, text) %>%
    anti_join(stop_words_list) %>%
    add_count(word) %>%
    filter(n > stats::quantile(n, counts_quantile)) %>%
    pairwise_cor(word, page, sort = TRUE) %>%
    filter(correlation > correlation_threshold,
         !str_detect(item1, "\\d"),
         !str_detect(item2, "\\d")) %>%
    graph_from_data_frame() %>%
    ggraph(layout = "fr") +
    geom_edge_link(aes(edge_alpha = correlation), show.legend = FALSE) +
    geom_node_point(color = "lightblue", size = 5) +
    geom_node_text(aes(label = name), repel = TRUE) +
    theme_void() -> p

  return(p)
}
bjp_content %>%
plot_common_correlated_words(stop_words_list = custom_stop_words,
counts_quantile = 0.75) +
labs(x = "",
y = "",
title = "Commonly Occurring Correlated Words in BJP's Manifesto",
subtitle = "Per page correlation higher than 0.25",
caption = "Based on election 2019 manifesto from bjp.org") -> p_bjp
congress_content %>%
plot_common_correlated_words(stop_words_list = custom_stop_words,
counts_quantile = 0.75) +
labs(x = "",
y = "",
title = "Commonly Occurring Correlated Words in Congress's Manifesto",
subtitle = "Per page correlation higher than 0.25",
caption = "Based on election 2019 manifesto from inc.in") -> p_congress
grid.arrange(p_bjp, p_congress, ncol = 2, widths = c(12,12))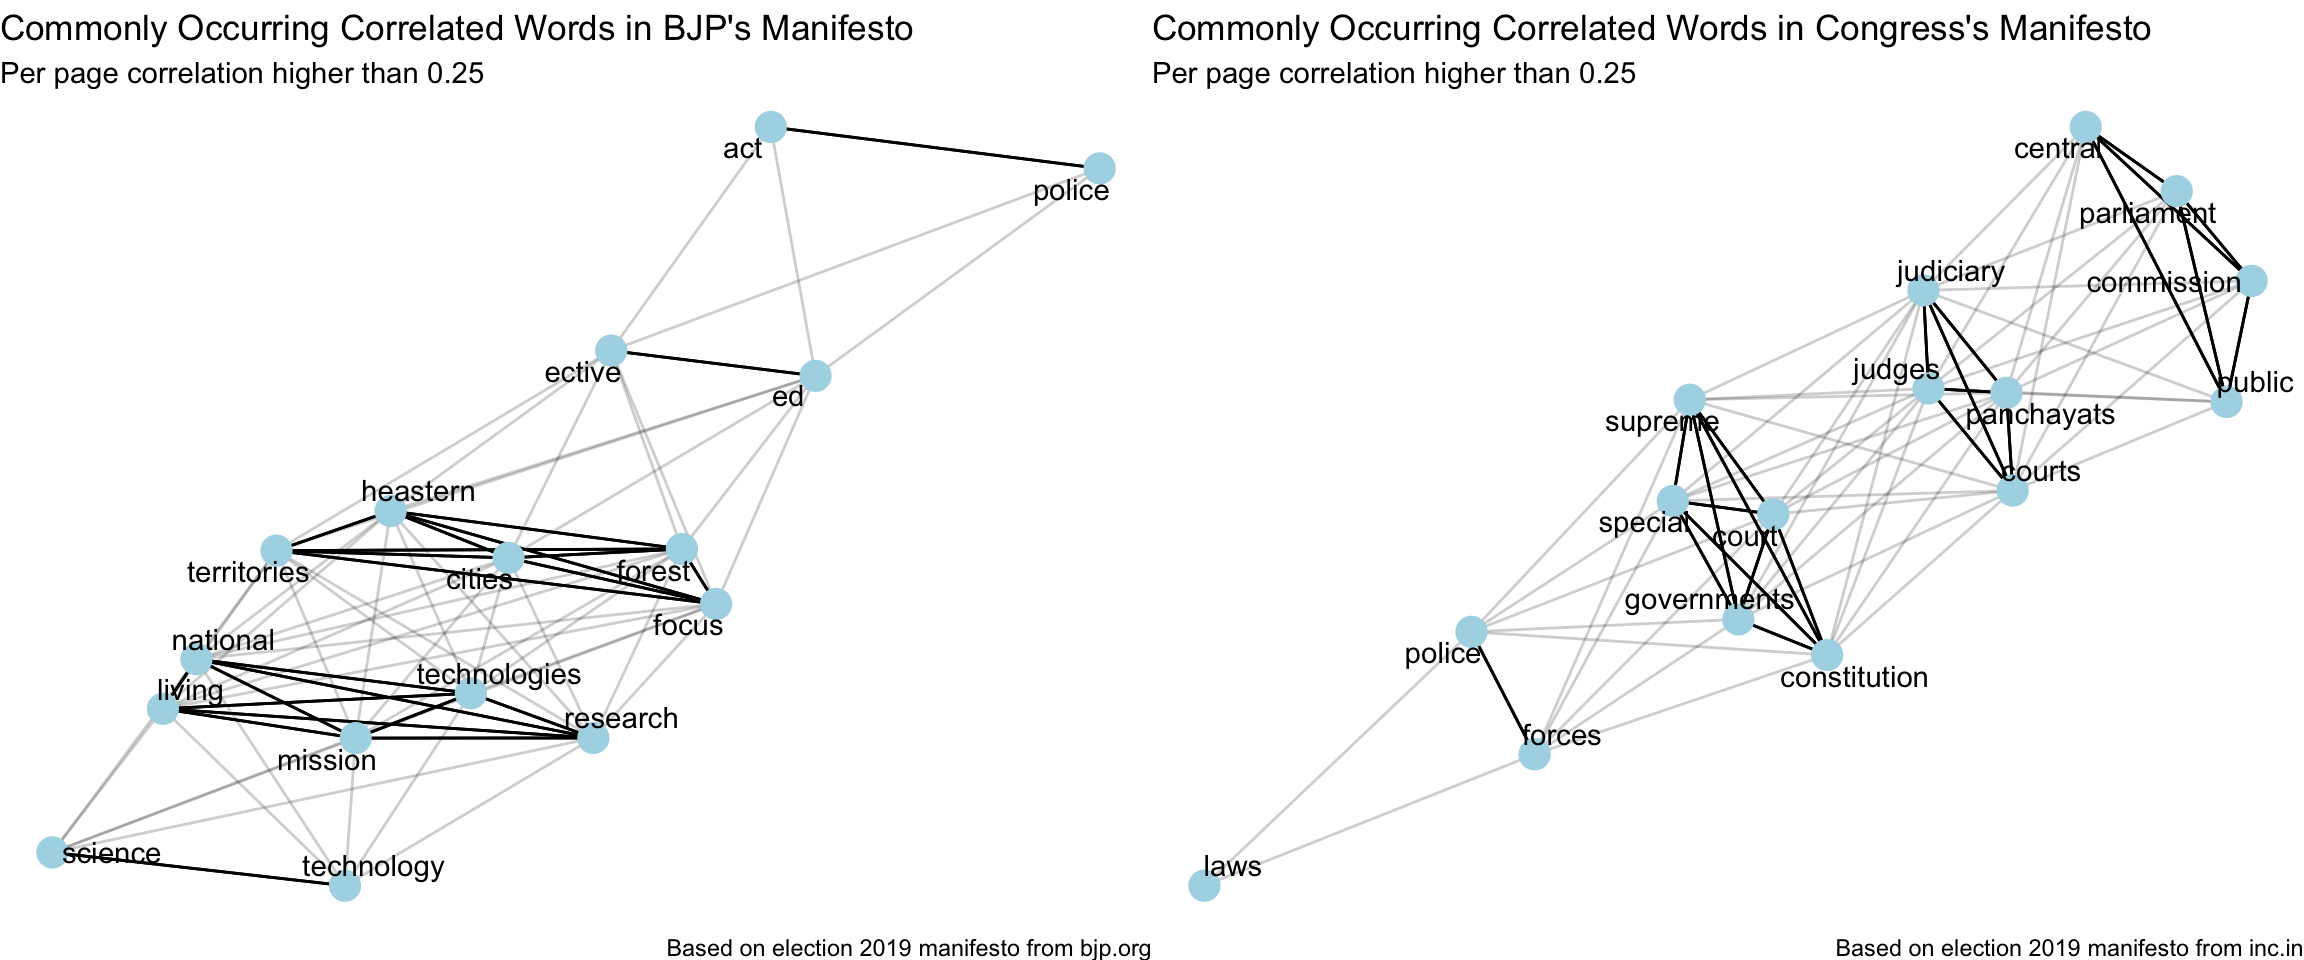
Basic Search Engine
Lets build a cosine-similarity based simple search engine (instead of the basic keyword-based search that comes with the pdf document), in order to make these documents more easily searchable and gain context using most related lines in the manifestos for a given query. Using python’s scikit-learn for this.
from sklearn.feature_extraction.text import TfidfVectorizer, ENGLISH_STOP_WORDS
from sklearn.metrics.pairwise import linear_kernel

stopwords = ENGLISH_STOP_WORDS

vectorizer_bjp = TfidfVectorizer(analyzer='word', stop_words=stopwords, max_df=0.3, min_df=2)
vector_train_bjp = vectorizer_bjp.fit_transform(r["bjp_content$text"])

vectorizer_congress = TfidfVectorizer(analyzer='word', stop_words=stopwords, max_df=0.3, min_df=2)
vector_train_congress = vectorizer_congress.fit_transform(r["congress_content$text"])

def get_related_lines(query, party="bjp"):
  if (party == "bjp"):
    vectorizer = vectorizer_bjp
    vector_train = vector_train_bjp
  else:
    vectorizer = vectorizer_congress
    vector_train = vector_train_congress
  vector_query = vectorizer.transform([query])
  cosine_sim = linear_kernel(vector_query, vector_train).flatten()
  return cosine_sim.argsort()[:-10:-1]
get_related_lines <- py_to_r(py$get_related_lines)Common Popular Words with both BJP & Congress
As we see from the plot above, one of the most popular words in both BJP and Congress’ manifesto is “police”. Lets see, what each of them have planned for our police force. First, BJP.
bjp_content %>%
  slice(get_related_lines("police", party = "bjp")) %>%
  select(text, page, line)
## # A tibble: 9 x 3
## text page line
## <chr> <dbl> <dbl>
## 1 upon the colonial police force and there is a need to change and … 24 31
## 2 peaceful law and order is the key to growth and development. our … 24 30
## 3 grassroots. 24 27
## 4 challenges of the 21st century. therefore, we will bring police r… 24 32
## 5 06 police is the most basic and key functionary a ecting the peop… 24 29
## 6 police reforms 24 28
## 7 science and technology 25 21
## 8 09 in order to establish india as a hub of nancial services, we w… 25 5
## 9 act’ in consultation with the states to have a pro-people citizen… 24 33This is the excerpt that we find from page 24, as we dug up based on above results -
Police is the most basic and key functionary affecting the people’s life. An effective policing and peaceful law and order is the key to growth and development. Our present police and policing is based upon the colonial police force and there is a need to change and transform the police according to the challenges of the 21st century.Therefore, we will bring Police Reform. We will formulate a ‘Model Police Act’ in consultation with the States to have a pro-people citizen friendly police. This will take the Indian policing at par with its contemporaries anywhere in the world.
Now, Congress.
congress_content %>%
  slice(get_related_lines("police", party = "congress")) %>%
  select(text, page, line)
## # A tibble: 9 x 3
## text page line
## <chr> <dbl> <dbl>
## 1 of the state police under the direct command 19 41
## 2 ots, lynchings and gang rapes by a special wing 19 40
## 3 tion agency that has the power to search, seize, 19 18
## 4 civil penalties; atta… 19 20
## 5 06. amend the armed forces (special powers) … 19 35
## 6 the powers of security forces and the human rights r… 19 37
## 7 been misused and, in any event, has become rela… 19 25
## 8 during custody or interrogation and punish cases t… 19 33
## 9 (that defines the offence of ‘sedition’) that has 08. amend… 19 24One of the excerpts from page 19 related to above results -
Provisions will be made in the Model Police Act to: a. Make the State police force accountable to an independent Police Accountability Commission as well as to give an annual report to the State Legislature. b. Decentralise the police force in the State and to involve the community in the oversight of the police force. c. Cause investigations into cases of communal riots, lynchings and gang rapes by a special wing of the State police under the direct command of the State Headquarters of the police.
Unique popular words with BJP & Congress
One of the popular words that seems curious from BJP’s manifesto is “forest”.
bjp_content %>%
  slice(get_related_lines("forest", party = "bjp")) %>%
  select(text, page, line)
## # A tibble: 9 x 3
## text page line
## <chr> <dbl> <dbl>
## 1 coordination with the private sector. 26 5
## 2 forest and environment 26 6
## 3 20 we have ensured speed and e ectiveness in issuing forest and e… 26 7
## 4 the mission cities by at least 35% over the next ve years. 26 15
## 5 and cooking gas connection in addition to houses and toilets, at … 26 18
## 6 states is adequately protected and take steps to ensure the same. 26 43
## 7 international financial services centre authority 25 4
## 8 act’ in consultation with the states to have a pro-people citizen… 24 33
## 9 policing at par with its contemporaries anywhere in the world. 24 34An excerpt from BJP’s manifesto about forests as identified from above -
We have ensured speed and effectiveness in issuing forest and environmental clearances for eligible projects due to which we have added around 9000 Sq. Kms to the forest cover of the country. We are committed to maintaining this pace through adoption of cleaner practises to make our nation a greener country.
Now, one of the popular words that seems curious from Congress’ manifesto is “panchayat”.
congress_content %>%
  slice(get_related_lines("panchayat", party = "congress")) %>%
  select(text, page, line)
## # A tibble: 9 x 3
## text page line
## <chr> <dbl> <dbl>
## 1 freedoms of the people. 19 47
## 2 institutions 17 40
## 3 commissioners qualified persons drawn from dif- cong… 17 58
## 4 protect the freedom of journalists, uphold editorial independence… 17 57
## 5 act. in accordance with the letter and spirit of the 07. rules… 17 56
## 6 council of india act, 1978 to strengthen the system of self-regul… 17 55
## 7 best way to correct the abuse of media freedom. we will amend the… 17 54
## 8 act, 2005 in the light of its working in the last 06. congr… 17 53
## 9 them accountable to parliament. we believe that self-regulation i… 17 52Congress was the proponent and author of the Constitution 73rd and 74th Amendments. Panchayati Raj lies at the core of good governance in our country, where the majority of citizens live outside metropolitan cities. Congress promises to take further measures to strengthen the concept of Local Government—Panchayats and Municipalities.
With all the above analysis, we have developed some idea about the Anti-corruption and Good Governance ideologies of the 2 parties. In the next post, I’ll do a similar analysis for Inclusion and Diversity proposals by them.
Stay Tuned!
References
- Part 3 - Employment and Opportunities
- Part 5 - Inclusion and Diversity
- For all the parts go to Project Summary Page - India General Elections 2019 Analysis