Christmas Bird Counts: TidyTuesday
TidyTuesday
Keywords
tech, DataAnalysis, R, Visualizations, TidyTuesday
Introduction
Visualizing bird watching data as collected in Hamilton area of Ontario during Christmas time since 1921. Working on the weekly social data project Tidy Tuesday.
Analysis
Load libraries
rm(list = ls())
library(tidyverse)
library(lubridate)
library(ggplot2)
library(gganimate)
library(gridExtra)
library(scales)
theme_set(theme_light())
bird_counts <- readr::read_csv("https://raw.githubusercontent.com/rfordatascience/tidytuesday/master/data/2019/2019-06-18/bird_counts.csv")
bird_counts## # A tibble: 18,706 x 6
## year species species_latin how_many_counted total_hours how_many_counte…
## <dbl> <chr> <chr> <dbl> <dbl> <dbl>
## 1 1921 American … Botaurus lent… 0 8 0
## 2 1921 American … Anas rubripes 0 8 0
## 3 1921 American … Fulica americ… 0 8 0
## 4 1921 American … Corvus brachy… 0 8 0
## 5 1921 American … Spinus tristis 0 8 0
## 6 1921 American … Falco sparver… 0 8 0
## 7 1921 American … Anthus rubesc… 0 8 0
## 8 1921 American … Turdus migrat… 1 8 0.125
## 9 1921 American … Picoides dors… 0 8 0
## 10 1921 American … Spizelloides … 12 8 1.5
## # … with 18,696 more rowsbird_counts %>%
summary## year species species_latin how_many_counted
## Min. :1921 Length:18706 Length:18706 Min. : 0.0
## 1st Qu.:1947 Class :character Class :character 1st Qu.: 0.0
## Median :1970 Mode :character Mode :character Median : 0.0
## Mean :1970 Mean : 193.5
## 3rd Qu.:1994 3rd Qu.: 5.0
## Max. :2017 Max. :73000.0
##
## total_hours how_many_counted_by_hour
## Min. : 8.0 Min. : 0.000
## 1st Qu.:149.5 1st Qu.: 0.000
## Median :171.0 Median : 0.000
## Mean :170.8 Mean : 1.336
## 3rd Qu.:203.8 3rd Qu.: 0.051
## Max. :251.0 Max. :439.024
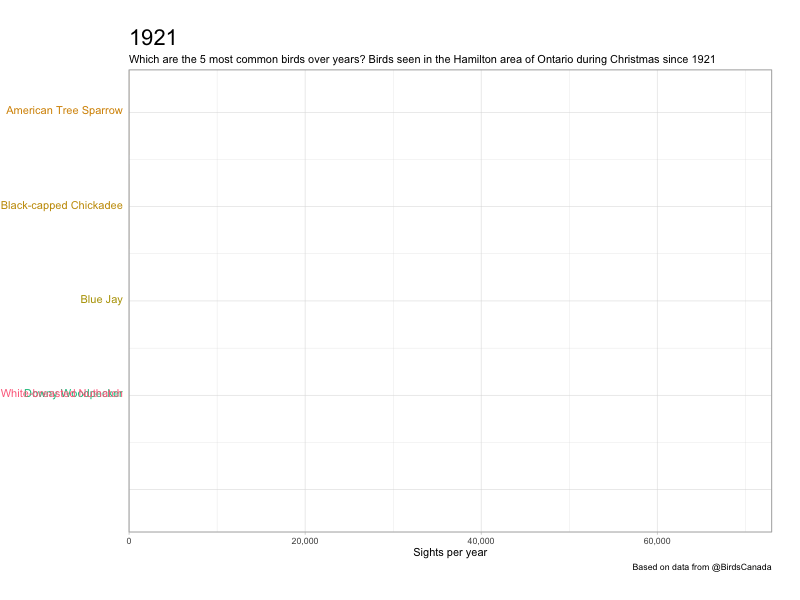
## NA's :3781 NA's :3781Which are the 5 most common birds over years?
bird_counts %>%
  group_by(year) %>%
  mutate(rank = min_rank(-how_many_counted) * 1) %>%
  ungroup() %>%
  filter(rank <= 5) %>%
  ggplot(aes(rank,
             group = species,
             fill = as.factor(species),
             color = as.factor(species))) +
  geom_tile(aes(y = how_many_counted/2,
                height = how_many_counted,
                width = 0.9),
            alpha = 0.8,
            color = NA) +
  geom_text(aes(y = 0,
                label = paste(species, " ")),
            vjust = 0.2,
            hjust = 1) +
  coord_flip(clip = "off",
             expand = FALSE) +
  scale_y_continuous(labels = scales::comma) +
  scale_x_reverse() +
  guides(color = FALSE,
         fill = FALSE) +
  labs(title = '{closest_state}',
       subtitle = "Which are the 5 most common birds over years? Birds seen in the Hamilton area of Ontario during Christmas since 1921",
       caption = "Based on data from @BirdsCanada",
       x = "",
       y = "Sights per year") +
  theme(plot.title = element_text(hjust = 0, size = 22),
        axis.ticks.y = element_blank(),
        axis.text.y = element_blank(),
        plot.margin = margin(1,1,1,4,"cm")) +
  transition_states(year, transition_length = 4, state_length = 1) +
  ease_aes('cubic-in-out') -> p
p %>%
animate(fps = 5,
nframes = 200,
duration = 30,
width = 800,
height = 600,
renderer = gifski_renderer("../data/christmas_bird_counts/most_common.gif"))